Population Aging and the Ontario Disability Support Program (ODSP)
Don Kerr, Tracy Smith-Carrier, Juyan Wang, Dora Tam and Siu Ming Kwok
dkerr [at] uwo [dot] ca
Abstract
The number of beneficiaries on social assistance in Ontario is not of minor importance, with almost a million (964,182) participants province wide in 2016. The number of persons on the Ontario Disability Support Program (ODSP) has rapidly increased, from about 280,000 in 2003 to over 475,000 in late 2016, for a rather dramatic increase of about 70 per cent. The reasons for this increase in ODSP are not straightforward, although population aging has frequently been cited as an important factor contributing to this growth. The primary purpose of the current paper is to provide a quantitative fix as to the relative importance of population growth and shifts in Canada’s age distribution to the rather pronounced increase in ODSP participation. We estimate here that demography alone can be considered responsible for only about 28 per cent of the overall growth in ODSP over the 2003-2014 period. The relatively modest impact of demography was less than initially anticipated in light of the distinct age/sex pattern of ODSP participants and some rather important shifts in the age sex structure of Ontario.
Key Terms
- Disability
- Social Assistance
- Income support
- Demography
- Population Aging
Population Aging and the Ontario Disability Support Program (ODSP)
Don Kerr, Tracy Smith-Carrier, Juyan Wang, Dora Tam and Siu Ming Kwok
dkerr [at] uwo [dot] ca
Introduction
One of the essential features of the changing population of Canada, caused primarily by the long-term changes in birth and death rates, is the transformation of the age distribution. Although population aging has been going on for many decades, the 2016 Census release on age and sex composition has again made headlines across the country (Statistics Canada, 2017a). The importance of understanding the changing age structure is evidenced by the fact that the book Boom, Bust and Echo by the demographer/economist David Foot (2000) made the national bestseller list in Canada for many months. Foot wrote eloquently about the importance of population aging and demographics for understanding both individual-level questions, like one’s relative life chances, and macro questions, like social and economic trends.
Demographers have long considered both the “causes” of population aging and the subsequent demographic ramifications for public policy (Trovato, 2009; Kerr & Beaujot, 2016). The aging of Canada’s population has a number of demographic ramifications, including fewer births, more deaths and lower population growth (through natural increase). Yet population aging has a number of important policy implications, as for example, many forecasts suggest climbing costs associated with health care and public pensions (Canadian Institute for Health Information [CIHI], 2011, Whittaker et al., 2016). Shifts in the age structure can be a challenge for any society to the extent that government expenditures rise or fall in order to accommodate relatively large age cohorts as they move through their life course.
Less appreciated is the extent to which shifts in the age structure can have an impact on government programs meant to target the working age population, including the demand for provincial social assistance. The Ontario government provides social assistance through either Ontario Works (OW), described by the Ministry as providing income assistance for individuals and families in “temporary” financial need, and the Ontario Disability Support Program (ODSP), described as providing “longer term income support for people with disabilities”. The emphasis of the current paper is on the latter of the two programs (ODSP), as we attempt to approximate the impact of shifts in Canada’s age/sex structure on the number of Ontarians seeking this form of income support. As disability is strongly associated with age, it is logical that the movement of large cohorts into middle age over the last decade and a half (into their 50s and early 60s) would have had an impact on the demand for programs like ODSP. The primary purpose of the current paper is to provide a quantitative fix as to the relative importance of shifts in Canada’s age distribution to the rather pronounced increase that has been observed as of late in the number of disabled Ontarians receiving ODSP.
Social Assistance in Ontario
The Ontario Ministry of Community and Social Services administers social assistance for the province. An important part of its mandate is “to help the province’s most vulnerable citizens” while simultaneously trying to “promote an ethic of self-reliance through employment” (Ministry of Community and Social Services, 2016). While the Federal Government is responsible for the management and delivery of Canadian Pension Plan (CPP)-Disability, the Veterans’ Disability program and Employment Insurance (EI) (sickness/disability benefits), provincial governments in Canada manage both social assistance programs as well as various workers’ compensation programs, including the Workplace Safety and Insurance Board (WSIB) in Ontario. For Ontario residents who do not qualify for any of aforementioned federal programs nor WSIB, and are without access to private disability insurance or other forms of income support, there is no other choice but to rely upon provincial social assistance (OW or ODSP). In addition, the provincial government also has two small programs of social assistance that provide income support to children in lower income households, i.e. the Temporary Care Assistance (TCA) program and Assistance for Children with Severe Disabilities Program (ACSD).
The number of beneficiaries on social assistance in Ontario is not of minor importance, with almost a million (964,182) participants province wide in 2016 (Figure 1). As of September 2016, the province reported 475,437 ODSP beneficiaries, 451,491 OW beneficiaries, as well as an additional 37,254 children supported through either the TCA or ACSD programs. In combination, this amounts to roughly 6.7 per cent of the province’s total population, up from roughly 5.5 per cent a decade and a half earlier. This has important social and economic consequences as the level of income support associated with both OW and ODSP has been described as being punishingly low (Graefe, 2016). For example, the maximum monthly income obtained from OW (as set by the province) for a single adult is only $706 a month in 2017, or about $8,470 a year. Similarly, the monthly maximum for a single person on ODSP is not much higher at only $1,128, or $13,536 a year. By way of contrast, this latter figure is roughly 60% of what a full year, full-time Ontario employee (35 hours a week) working at minimum wage ($11.40 an hour) earns, at about $20,750.
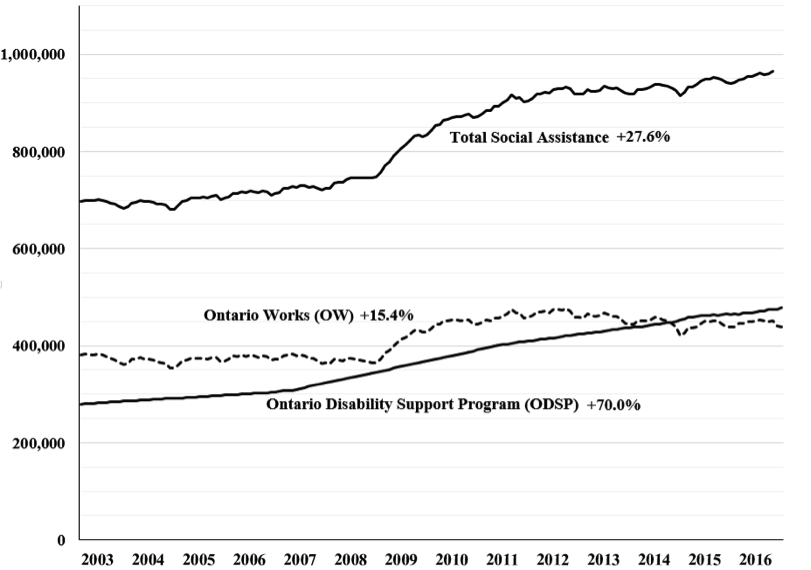
Source: Total Assistance (2003-2016) is available from the Ministry of Community and Social Services’ website (https://www.ontario.ca/data/social-assistance-caseloads); these numbers include not only OW and ODSP but also the small numbers associated with the TCA and ACSD programs. Estimates on OW and ODSP (2003-2013) are provided by the authors using Ministry of Community and Social Services’ Administrative Data. Data on OW and ODSP (2013-2016) are available directly from the Ministry of Community and Social Services in its Monthly Statistical Reports.
In terms of all social assistance in Ontario, the total number of participants has climbed by 27.6 per cent since 2003, although a large part of this growth has been among persons receiving ODSP. The economic downturn in 2008 was particularly important in impacting the OW caseload, as the number of beneficiaries increased from about 370,000 in mid-2007 up to a peak of almost 480,000 by 2011. Since this point in time, the number of OW beneficiaries has remained relatively stable, and actually declined slightly, whereas the number of Ontarians on ODSP has continued to increase. With ODSP, we have seen a larger and steadier increase in caseload throughout this entire period, both before and after the 2008 recession. The number of persons on ODSP province-wide has steadily increased, from about 280,000 in 2003 to over 475,000 in late 2016, for a rather dramatic increase of about 70 per cent. By way of contrast, this compares to a growth of 15.4 per cent if we consider exclusively persons on OW, which is actually roughly equivalent to the overall rate of population growth (15.7 per cent) for Ontario (Statistics Canada, 2016).
While the number of beneficiaries on OW has always been impacted by important economic events - for example, the caseload increased rather dramatically during the economic recessions of the early 1980s and early 1990s - growth in the number of ODSP participants has not been as impacted to the same extent by ups and downs in the state of Ontario’s economy. Yet taking the 2003-2016 period overall, growth in the number of persons on ODSP has far outstripped population growth, i.e. growth in participation was almost five times the rate of population growth. As a result, for the first time in the province’s history, in September 2014, the number of persons on ODSP actually grew to outnumber the total on OW (Ministry of Community and Social Services, 2016a). It is far from certain as to whether recent trends will continue over the next decade.
The reasons for this increase in ODSP are not straightforward and require additional study. Stapleton (2013) has briefly listed various drivers, including: “an aging population, lower rates of standard employment (and thus lower access to work-based disability benefits), greater acceptance and diagnosis of mental illness”, among other factors. The primary emphasis here is in quantifying the impact of demography, specifically demographic growth and population aging.
Population Aging and the Demand for ODSP in Ontario
A fundamental method in understanding the consequences of demographic change is cohort analysis. Technically speaking, the word cohort can be understood as “any group of persons who experience the same significant event in a particular time period, and who can thus be identified as a group in subsequent analysis” (Wilson, 1985). While the significant event can be almost any baseline-defining event, most commonly, cohorts are defined in terms of year of birth. For example, persons born in Canada between the years of 1946 and 1964 have widely been acknowledged by demographers and the general public alike as the baby boom cohort. While this is a very broad birth cohort, its relative size has long been considered important in understanding the dynamics of population change in Canada.
By juxtaposing the 2003 and 2016 pyramids, Figure 2 shows the dynamism underlying Ontario’s age structure, and in particular, the rather pronounced impact of certain cohorts as they move through their life course. In 2003, Ontario’s largest cohorts (born toward the end of the baby boom era) were just beginning to move into their 40s, whereas by 2016 these same cohorts were moving into their mid to latter 50s. As a proportion of Ontario’s population, much publicity has been given to the growth in the number of persons of retirement age (the 65+ age group has gone up from 12.6 per cent in 2003 to 16.4 per cent by 2016), yet also important has been the movement of large cohorts into their 50s and 60s (with the percentage aged 50-64 up from 16.5 to over 21.1 per cent). Overall, the relative weight of Ontario’s population over the age of 50 has shifted from about 3 in 10 Ontarians in 2003 (29.1 per cent) to almost 4 in 10 by 2016 (37.5 per cent). While this has had an upward pressure on many government programs and services, it has also logically had an impact on the number of Ontarians who may need income support due to a disability/sickness or chronic disease.
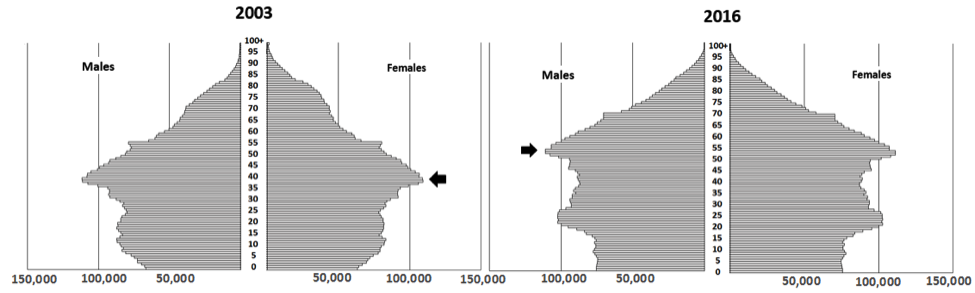
Note: The arrows in this diagram show the same birth cohort, in 2003 and 2016.
Source: CANSIM, Statistics Canada, Population Estimates, Annual
While there is some uncertainty about the effect of aging on the economy, one of its least ambiguous consequences is an increase in the role of government in transferring resources from the working age population to those who are not working. Although Denton and Spencer (2010) do not expect particularly large increases in government expenditures overall, they do foresee substantial changes in the nature of government expenditure, changes that will entail major economic and political adjustments. The demand for social assistance can be impacted by shifts in the age structure, although aging in itself logically impacts OW and ODSP differently. This is primarily due to differences in the age structure of social assistance beneficiaries. As outlined briefly by Lankin and Sheikh (2012), ODSP beneficiaries are considerably older than OW beneficiaries, by more than a decade on average.
While aging affects a number of social programs, the demand for social assistance is not as directly tied to age as are public pensions due to the simple reality that sickness, chronic illness and disability can potentially impact persons across all ages (Corscadden et al., 2013). Yet the demand for ODSP logically increases by age group, up to retirement age. Accordingly, the number of Ontarians who benefit from ODSP plummets at age 65 since the overwhelming majority of Ontarians qualify for other forms of income support (including the CPP, the Old Age Security pension (OAS), the Guaranteed Income Supplement (GIS) and Ontario’s Guaranteed Annual Income System (GAINS)). While for most Ontarians, reaching retirement age is typically associated with a reduction in disposable income, for a minority on social assistance, reaching one’s 65th birthday can lead to a significant improvement in disposable income.
The Age Profile of Social Assistance in Ontario
The age profile of social assistance in Ontario differs somewhat, dependent upon whether the emphasis is on ODSP or OW. While ODSP participants are more likely to be older and middle aged, OW beneficiaries are far more likely to be young adults and children. This relates to what is known of the life circumstances and living arrangements of OW recipients, as well as the relationship between aging and disability for ODSP recipients (i.e. disability rates increase as we move into middle age). In addition, OW beneficiaries are much more likely to be part of a family, often single parents with children, whereas ODSP recipients are much more likely to be older, single and living alone.
Figure 3 summarizes by 5-year age groups, Ontario participation rates of persons receiving OW and ODSP, by age and sex. In so doing, the distinctive age profile of each program type is provided; pre-school age children and young adults are over represented among OW recipients, whereas with ODSP, participation rates rise steadily with age – particularly as we move into middle age. The OW rates are consistent with what is known of the difficulties that young adults face in efforts to establish themselves in the labor market, difficulties that are often compounded when young adults also have child care responsibilities. Similarly, the ODSP rates are completely consistent with what is known of population health, aging and disability, i.e. the participation rate climbs noticeably as we move from young adulthood into middle age, highest for persons in their upper 50s, and almost as high for persons aged 50-54 and 60-64 years.
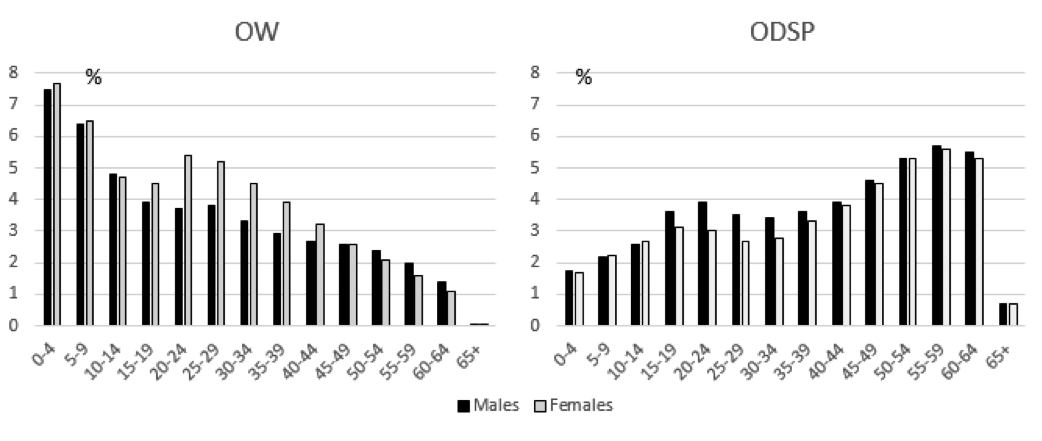
Source: Authors’ estimates using the Ministry of Community and Social Services, Administrative Data
In its monthly statistical report, the Ministry of Community and Social Services (2016a) shows how almost one half of all OW beneficiaries in Ontario (or roughly 45 per cent) involve sole support parent families with children. In light of this, participation rates are particularly high for children and among younger adults – and among younger women in particular. It has long been true that one of the largest single demographic groups to receive social assistance in Ontario are lone parents – which at least partially explains the higher percentage of women of childbearing age receiving OW. At older ages in moving into middle age, men are actually more likely to be receiving OW than women. The difficulties that many new parents face in balancing both childcare and employment are consistent with the observation that a particularly high proportion of very young children (aged 0-4) are in families that receive OW, only to observe somewhat lower proportions for families with elementary and high school age children. At older ages, a much lower proportion of Ontarians are on OW, particularly among adults moving into middle age.
Among ODSP recipients a somewhat different situation emerges, again dictated by the positive association that exists between disability and age. Disability obviously increases as we move through the life course, so logically the proportion on ODSP also increases. For example, Statistics Canada (2013) has estimated that while fewer than 1 in 20 Canadians at age 20 report a disability, this proportion rises to about 1 in 5 among Canadians in their latter 50s. In fact, a substantial proportion of Ontarians on ODSP are currently approaching retirement, a milestone that will lead to a significant improvement in their economic circumstances as soon as they qualify for the more generous government pensions.
Among Ontarians of childbearing age, women are slightly more likely to be on social assistance (primarily on OW), whereas among older adults, it is the men that are marginally more likely to be on social assistance (when we consider ODSP and OW in combination). A very small proportion of Ontarians beyond the age of 65 rely upon social assistance, i.e. primarily newcomers who have not met the residency requirements for OAS, GIS and/or the GAINS pensions.
Estimating the impact of population aging on the demand for social assistance
Standardization and decomposition techniques are common in demography and related social sciences, particularly when comparing events or prevalence rates across populations that may differ in terms of age/sex structure (or some other demographic characteristic). For example, in the study of health outcomes, standardization is often used by researchers to remove the effect of age/sex differences across populations (Das Gupta, 1993; Seigel, 2002). Epidemiologists often employ standardization when comparing the prevalence of a specific type of disease or disability (Public Health Agency of Canada, 2006) whereas Statistics Canada often produces “age standardized rates” in examining the prevalence of specific types of chronic diseases or deaths over time or across populations (Statistics Canada, 2014). As merely an example of its utility, standardization can allow for the estimation of how the incidence of a specific type of chronic disease (e.g. heart disease) might have evolved in a population in the absence of population aging.
In a similar manner, decomposition techniques build on standardization in efforts to estimate the relative importance of compositional factors (e.g. age/sex structure) relative to rate factors (e.g. age/sex specific death rates) in explaining differences in overall rates over time. In terms of populations that are aging, decomposition can estimate the additive contributions of population aging, population growth, and changes in age specific factor rates. As an example, the CIHI (2014) has used decomposition techniques to approximate the relative importance of demographic change to the demand for health care in Canada. As this demand is obviously directly linked to expenditures and these costs are directly linked to age, the CIHI has identified population change (growth and aging) as a relevant cost driver of public sector spending, and estimated that demography alone may very well be responsible for about a quarter of the overall increase in public health expenditures in Canada for the 2000-2010 period (CIHI, 2014, p. 25). While many other factors have contributed to escalating costs, including health care inflation and some rather major changes in the technologies and services utilized, this sort of analysis is particularly useful for planning purposes as there are often some rather predictable shifts in age structure that can impact the demand for specific types of services over time.
The current paper will attempt to “decompose” the reported increase in the number of persons receiving ODSP (and OW) in Ontario in terms of both population growth and some rather important shifts in the age structure over the 2003-2014 period. For our purposes, we focus on primary applicants for social assistance rather than all beneficiaries (all members of the family in receipt of social assistance). Whereas the overall number of beneficiaries for both OW and ODSP has risen considerably (see earlier discussion), so too has the total number of primary applicants by a comparable extent, up by 65.6 and 23.8 per cent respectively (2003-2014). In working with primary applicants as identified in the Ministry’s administrative data, our decomposition shows here how shifts in Ontario’s age/structure in isolation has actually served to slightly dampen the growth in the number of OW applicants while simultaneously adding to the growth in the number obtaining ODSP. Without overstating the importance of demography, this again relates to the aforementioned distinctive age/sex pattern as observed for OW and ODSP recipients and some rather fundamental shifts in the province’s age structure.
Indirect Standardization with 2003 Age/Sex Participation Rates
In approximating the impact of demographic change, we begin with a simple standardization exercise. In conducting standardization, demographers typically employ one of two options: direct or indirect standardization. These two closely interrelated techniques are commonly used to compute "age-adjusted" summary rates. Briefly, direct standardization involves applying a standard age/sex distribution to populations being compared, whereas indirect standardization applies a standard set of age-specific rates to populations that differ in terms of age/sex structure. Both methods allow for the computation of events or summary rates that can then be systematically compared with the events or summary rates as actually observed.
Standardization can provide some indication as to the relative importance of population growth and compositional differences across populations. Due to data constraints (an absence of age/sex specific rates for all years in our time series), we apply here indirect standardization, i.e. rates as observed in 2003 will be applied to Statistics Canada’s time series of population estimates (2003-2014). In working with information on the age/sex distribution of primary applicants (for ODSP and OW separately), the standardization begins with the calculation of stratum specific participation rates (5 year age/sex groups) for 2003. The resultant age/sex specific rates can then each be applied to the time series of population estimates for the full 2003-2014 period, to obtain hypothetical estimates of primary applicants receiving social assistance in Ontario, under the assumption that 2003 rates remain unchanged.
In conducting the same procedure for all years (2003-2014), the simulated growth in the numbers receiving social assistance can be read to approximate the impact of population growth and shifts in the age/sex structure. Briefly, Figure 4 summarizes the results with ODSP, whereas Figure 5 does the same with OW. In a sense, these simulations based on indirect standardization provide us with a feel as to the relative importance of demography to the well documented upturn in the caseload associated with both programs.
As implied in Figure 4, while the total number of primary applicants on ODSP grew by 65.6 per cent over the 2003-2014, our standardization suggests that only a part of this growth can be linked back to population growth and population aging (18.4 per cent). As this growth is greater than what was observed for Ontario’s population overall (12.5 per cent), this implies that shifts in age distribution have had an impact on this upturn in the number on ODSP. Under ideal conditions, one might hope that age/sex specific rates be on the decline (as Ontarians of all ages succeed in obtaining employment, including those with disabilities) yet the results from this simulation are consistent with the opposite conclusion, i.e. regardless of what has happened in terms of age structure, we have seen a pronounced upturn in the participation rates of Ontarians across age groups.
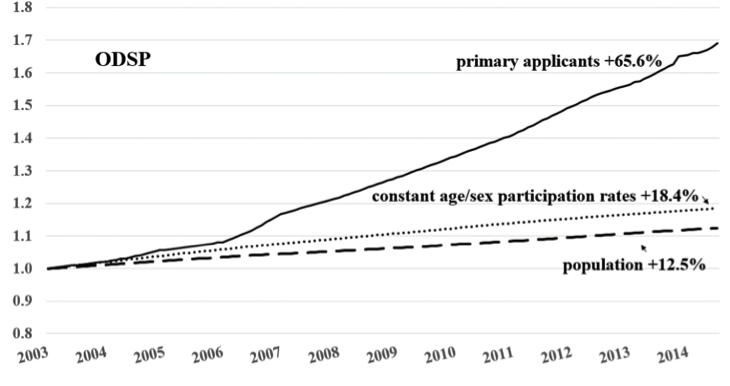
Source: Based on Administrative Data, Ontario Ministry of Community and Social Services, Population estimates, Statistics Canada CANSIM, authors’ calculations
Source: Based on Administrative Data, Ontario Ministry of Community and Social Services, Population estimates, Statistics Canada CANSIM, authors’ calculations
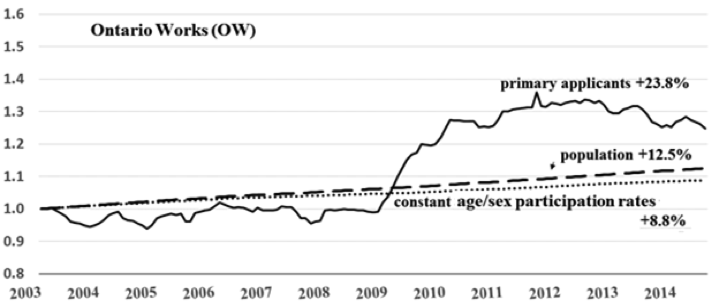
With regards to OW, Figure 5 presents the results from an analogous exercise, here we again have the simulated growth (+8.8 per cent), which in this case is found to be even slower than the province’s rate of population growth. This is consistent with the idea that population aging in and of itself has had a dampening effect on the demand for OW, which is logical as the largest cohorts have shifted to ages whereby the age specific rates are lower. By way of contrast, the actual observed increase in OW (+23.8 per cent) was almost double the rate of population growth (12.5 per cent) and almost triple the simulated growth presented here. For a variety of reasons, the number of persons on social assistance in the province has risen at a rate that is greater than what might be anticipated by population growth and shifts in the age distribution alone. Yet in considering the demand for social assistance in the province, shifts in the age structure appear to have had contradictory effects, dependent upon whether our emphasis is on those who apply for ODSP or OW.
Decomposition of the 2003-2014 Increase
As noted earlier, in combining all forms of social assistance, the number of social assistance beneficiaries has risen considerably across Ontario (up to close to a million individuals). In decomposition, the question can be asked as to how much of the recent increase might be considered due to the differences observed in age/sex specific participation rates over this period, and how much is due to the aforementioned change in the proportionate age distributions. Beyond this, the simple question is asked: how much might be considered the by-product of demography alone (population growth and population aging in combination). For the full 2003-2014 period, it is possible to decompose the growth as observed for ODSP and OW participants in a slightly more refined manner than what was implied in the standardization exercise presented above.
There are difficulties with standardization due to a simple problem that arises with this technique, i.e. the choice of a standard (as a population or as a set of age/sex specific rates) can sometimes have a significant influence on the results obtained. With this in mind, Das Gupta (1993) outlines a methodological solution to this problem, which is subsequently applied in the current context. In his decomposition, rather than selecting any specific year as the standard (for example, the year at the beginning or end of our study period), he worked with the “average proportionate age distributions” and “average age/sex specific rates”. In an effort to understand what is behind Ontario’s climbing rate of social assistance, we can enact this decomposition, again working with primary applicants to ODSP and OW, respectively (for further methodological details, see Das Gupta, 1993).
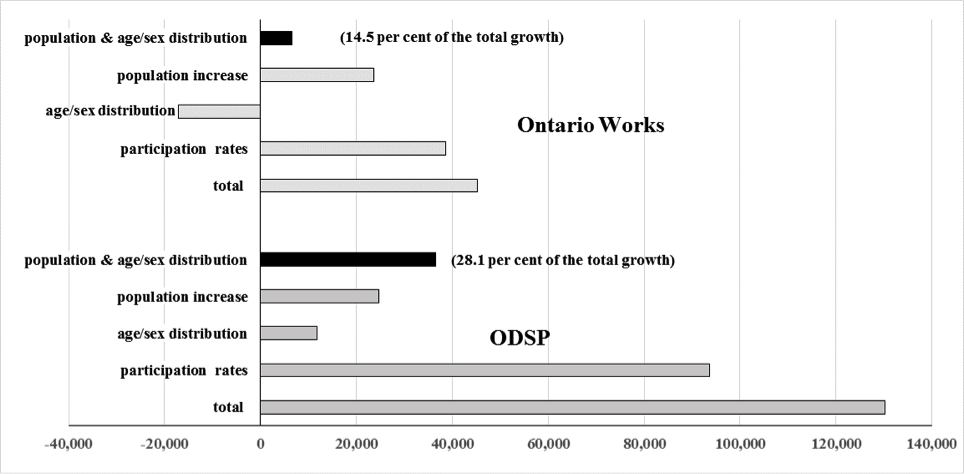
Figure 6 presents the decomposition results using this methodology, for ODSP and OW separately. Briefly, our decomposition suggests here that about 28 per cent of the growth in the ODSP program over the 2003-2014 period has been due to demography alone (i.e. population growth and population aging). For OW, we estimate here that roughly 14.5 per cent of the growth can be linked back to demography. We also show here how shifts in the age/sex distribution have moderately impacted growth of ODSP applicants while reducing growth in the number on OW. In other words, when we consider the number of persons on social assistance overall, the effect of population aging on the two programs has been offsetting to a certain extent, i.e. in a predictable manner, population aging has led the ODSP program to grow at a slightly more rapid pace than might have been expected whereas with OW, population aging has had the opposite effect.
Source: Based on Administrative Data, Ontario Ministry of Community and Social Services, Population estimates, Statistics Canada CANSIM, authors’ calculations
Summary and Discussion
Shifts in the age structure can be a challenge for any society to the extent that government expenditures rise or fall in order to accommodate relatively large age cohorts as they move through their life course. Less appreciated is the extent to which shifts in the age structure can potentially have an impact on government programs meant to target the working age population, including the demand for provincial social assistance. The primary contribution of the current paper was to examine the impact of demography (i.e. demographic growth and population aging) on the rather sustained increase in the number of ODSP (and OW) beneficiaries in Ontario over recent years. As disability is strongly associated with age, the primary contribution of the current paper was to consider more carefully the impact of age structure in this context and to provide a careful decomposition of the recent upturn in social assistance use.
In providing a quantitative fix, we estimate here that demography alone can be considered to be responsible for only about 28 per cent of the overall growth in ODSP over the 2003-2014 period. The relatively modest impact of population growth and aging was less than initially anticipated in light of the distinct age/sex pattern of ODSP participants and some rather important shifts in the age sex structure of Ontario. In addition, we demonstrate here how shifts in age structure have not only moderately contributed to ODSP growth, but simultaneously served to reduce slightly the demand for OW. In other words, when we consider the number of persons on social assistance overall, the effect of population aging on the two programs has been offsetting to a certain extent, i.e. population aging has led the ODSP program to grow at a slightly more rapid pace than might have been expected whereas population aging has had the opposite effect on the OW program.
Other factors beyond population aging are obviously important in explaining this increase in ODSP; Stapleton (2013) has listed various drivers, including lower rates of standard employment (and thus lower access to work-based disability benefits) and greater acceptance and diagnosis of mental illness. In this context, he makes the case that we have seen somewhat of a “welfareization of disability incomes” in both Ontario and in most other provinces. As more people rely on social assistance today than was the case historically, at least part of the explanation relates to the decline in the importance of other disability programs, including “private” disability plans. In addition, the likelihood of being diagnosed with a wide assortment of mental illnesses and disorders has increased, at least partially due to an increased awareness of mental health and disability issues. This suggests the utility of additional research into how exactly these income support programs (both private and public) manage health claims, and in particular, how might persons with mental disorders be treated differently from other Ontarians with more easily identifiable physical disabilities.
Recent developments in terms of Ontario’s economy are also relevant, i.e. while persons live on social assistance for a wide variety of reasons, it is logical that the increase in joblessness that followed the 2008 recession not only contributed to a growth in the numbers on OW, but also to an increase in the number on ODSP. As Ontario’s employment rate has yet to recover to pre-recession levels, additional research is appropriate as to how the average duration on OW has evolved, and to what extent the province is now experiencing longer durations and greater entrenchment of social assistance. With its dangerously inadequate benefits levels, it is completely logical that longer durations on OW would have negative health outcomes, which in turn could lead to increased numbers moving over to ODSP. Whether our emphasis is upon those that might be temporarily jobless, the working poor, or Ontarians on social assistance, the health consequences associated with severe poverty are real and well documented (Saraceno & Barbui, 1997; Shore, 1997).
The status quo appears to be one in which a growing proportion of the province’s population are diagnosed as disabled and in need of income support. In turn, Ontarians with disabilities continue to be profoundly overrepresented among the province’s poorest citizens. The irony here is that economists and demographers are increasingly pointing to a fundamental trend to characterize Ontario’s population, i.e. the growth in the size of its population of labour force age has been slowing noticeably as of late. Many forecasts suggest that this will lead to substantial labour shortages in the near future. In this context, we note that disabled Canadians continue to experience employment rates that are far below the national average. The challenge for the Ministry in this context is to how best reform social assistance to better integrate under-represented groups (Smith-Carrier, 2017) into meaningful and stable employment, particularly in a labour market increasingly reflective of precarious work. Further research seems appropriate as to how the employment prospects of disabled Ontarians have been evolving as of late, and how to best reform policy and regulation with this outcome in mind.
List of References
- CIHI, 2011. Health Care Cost Drivers: The Facts. Ottawa: Canadian Institute for Health Information.
- CIHI, 2014. National Health Expenditure Trends, 1975 to 2014. Ottawa: Canadian Institute for Health Information.
- Corscadden, Lisa, Michael Wolfson, Michel Grignon, Sara Allin. 2013. Who Uses and Pays for Healthcare Over a Lifetime – and How Does This Impact Income Inequality? Ottawa: Canadian Institute for Health Information.
- Das Gupta, P. 1993. Standardization and Decomposition of Rates: A User’s Manual. Washington D.C. Current Population Reports. U.S. Bureau of the Census Series P-23, No. 186.
- Denton, Frank and Byron Spencer. 2010. Chronic Health Conditions: Changing Prevalence in an Aging Population and Some Implications for the Delivery of Health Care Services, Canadian Journal on Aging 1:11-22.
- Foot, David. 2000. Boom, Bust and Echo 2000. Toronto: Macfarlane Walter and Ross.
- Graefe, Peter. 2016. Social Assistance in Ontario. Pp. 111-126 in Daniel Béland and Pierre-Marc Daigneault (eds.) Welfare Reform in Canada: Provincial Social Assistance in Comparative Perspective. Toronto: University of Toronto Press.
- Kerr, Don and Roderic Beaujot. 2016. Population Change in Canada. Toronto: Oxford University Press.
- Lankin, Frances and Munir Sheikh. 2012. Brighter Prospects: Transforming Social Assistance in Ontario. Toronto: Commission for the Review of Social Assistance in Ontario.
- Ministry of Community and Social Services, 2016. Mandate Letter, September 2016.
- Ministry of Community and Social Services, 2016a. Monthly reports: OW and ODSP.
- Public Health Agency of Canada, 2006. Report from the Canadian Chronic Disease Surveillance System. Ottawa.
- Seigel, Jacob. 2002. Applied Demography: Applications to Business, Government, Law and Public Policy. Orlando: Academic Press.
- Saraceno, Benedetto., & Corrado Barbui, 1997. Poverty and Mental illness. Canadian Journal of Psychiatry, 42, 285–290.
- Shore, Miles, 1997. Psychological Factors in Poverty. Pp. 305-329 in Lawrence Mead (ed.), The New Paternalism: Supervisory Approaches to Poverty (pp. 305–329). Washington, DC: Brookings Institute Press.
- Smith-Carrier, Tracy, 2017. Reproducing Social Conditions of Poverty: A Critical Feminist Analysis of Social Assistance Participation in Ontario, Canada. Journal of Women, Politics & Policy 38:1-24.
- Stapleton, John. 2013. More Thoughts on Ontario Social Assistance Caseloads. The Broadbent Blog, January 16.
- Stapleton, John. 2013b. The “Welfareization” of Disability Incomes in Ontario: What are the Factors Causing this Trend? Toronto: Metcalf Foundation.
- Statistics Canada, 2013. Disability in Canada: Initial findings from the Canadian Survey on Disability. Ottawa: Catalogue no. 89654X — No. 002.
- Statistics Canada, 2016. Annual Demographic Statistics. Population Estimates.
- Statistics Canada, 2017. Census Topics: Age and Sex, Type of Dwellings. Census Release. May 3, 2017.
- Trovato, Frank. 2009. Canada’s Population in a Global Context. Toronto: Oxford University Press.
- Whittaker, William ; Birch, Stephen, MacKenzie, Adrian and Gail Murphy. 2016. Cohort Effects on the Need for Health Care and Implications for Health Care Planning in Canada. Health Policy 120:81-88.
- Wilson, Chris. 1985. The Dictionary of Demography. Oxford: Blackwell Reference.