Access to Assistive Technology and Single Entry Point Programs
Diana L. Gustafson and Valerie Penton, Memorial University
Abstract
People with disabilities experience greater social and economic barriers and higher levels of poverty than people without disabilities. Assistive Technology (AT) helps address barriers and can positively impact the health of people with disabilities. Disparities in the provision of AT services and supports pose a threat to improved income, education, employment and wellbeing in regions where health disparities are associated with geographical, social and economic disadvantages.
This mixed method case study sought to explore the barriers consumers faced in acquiring and being satisfied with AT in Newfoundland and Labrador, an Atlantic Canadian province characterized by a small population dispersed over a large island and remote mainland. Data were collected using individual interviews with disability service providers in community and post-secondary settings across the province. Thematic analysis of these data informed the development of a survey used to assess barriers to accessing AT, and AT utilization and satisfaction among consumers with disabilities.
Consumers and service providers recognized the benefits of AT but expressed dissatisfaction with existing programs and services citing lack of knowledge, training, and funding subsidies as the most significant barriers to access. Three elements of a single entry point (SEP) system were regarded by consumers and service providers as having the potential to address these barriers. From a social justice perspective, improving access to AT is a necessary step toward enhancing education and employment opportunities, facilitating social inclusion and optimizing overall health for people with disabilities. Investigating the feasibility of SEP programs modeled after Canadian and Australian initiatives should be part of future planning for this province and other small urban, rural, and remote areas where demand for provision of AT is under-resourced.
Keywords
assistive technology; disability; single entry point program; mixed methods; social justice
Access to Assistive Technology and Single Entry Point Programs
Diana L. Gustafson and Valerie Penton, Memorial University
Imagine not being able to tell your doctor that you are getting an extreme pain in your right side, and then if you can take your laptop and type in to your doctor and show him the screen, then great. Then all of a sudden your health care changes. (S. Ralph, personal communication, March 20, 2009).
This opening quote from a respected advocate for disability rights in Newfoundland and Labrador highlights the dramatic improvement in health that having access to assistive technology can make for a person with a disability. Assistive technology (AT), also known as assistive devices, or in the case of computer-related devices, adaptive technology refers to a range of devices and equipment. AT such as wheelchairs, magnifying devices, and screen reading and speech software enable people with disabilities to engage more independently in work life and activities of daily living (Hopkins, 2004). AT is a critical equalizer for people with disabilities as these devices decrease barriers to, for example, social engagement, education, sustained and satisfying employment and a living wage (Christ, 2008; Hopkins, 2004; Strobel et al., 2006). However, studies in urban centres in Canada, the United States and elsewhere reveal significant disparities in the provision and access to AT programs and services (Hopkins, 2004; Hoppestad, 2007; Kaye, Yeager, & Reed, 2008). It is reasonable to assume that gaps in services might be more pronounced in regions with known geographical, social and economic disadvantages. Indeed, no Canadian province has been successful in ensuring that people with disabilities have all their needs met for AT devices and services (Statistics Canada, 2007). Failing to effectively address this problem means that people with disabilities might be less able to exercise their right to health. A social justice approach offers one way to put in place programs and services for enhancing individual health regardless of geographic location or level of ability.
Newfoundland and Labrador, the most easterly province in Canada, has a relatively small population (505,930) spread over a disproportionately large land mass. Nearly half of the residents live in rural and remote communities (Statistics Canada, 2008a). Community-based research and consultations driven by the provincial government indicate a rise in demand for AT and AT services (Independent Living Resource Centre, 2008; Government of Newfoundland and Labrador, 2012). It is unclear, however, if programs are keeping up with demand.
This paper draws on the findings of a case study that investigated access to AT from the perspective of AT consumers and the professionals who provided AT services and programs in Newfoundland and Labrador. The goal of the study was to generate information for community-based and government decision-makers responsible for designing, implementing and evaluating AT programs and services for people with disabilities. In a submission to the provincial Disability Policy Office (Penton & Gustafson, 2010) we reported that consumers and service providers recognized the benefits of AT but identified significant barriers to accessing services and support. Three elements of a single entry point (SEP) system were regarded as having the potential to address problems with access and gaps in service. We present those findings in greater detail here. Recommendations emerging from this study might be relevant for other jurisdictions that are under-resourced or where the population is dispersed over a large geographic area.
AT and the Determinants of Health
The social determinants of health play a significant role in shaping health outcomes and producing inequalities in health status between groups and among members of the same group or community. Disability is one of the social categories through which health inequities are manifest. According to the Commission on the Social Determinants of Health (2008), this inequity is linked to differential access to the economic, social, political and cultural relationships and resources that are necessary conditions for health and well-being. Although health is determined by a complex interplay of many factors, we focus here on four factors that are particularly salient given the unique geography and socio-economic history of Newfoundland and Labrador: income, education, employment and social environment.
Income is arguably the single most significant condition for healthy living. This is especially true for individuals with disabilities (Public Health Agency of Canada [PHAC], 2013). According to Statistics Canada (2007), 55% of people in Newfoundland and Labrador over 15 years of age with a disability have a total annual income of less than $16,000. This percentage is significantly higher than the national average of 40% during the same period, meaning that income is a serious barrier to good health for adults with a disability in this province. People with disabilities are also much more likely to be single and twice as likely as other Canadians to live in poverty. People living in poverty are less likely than their higher income peers to report very good or excellent health and more likely to become sick and have shorter life expectancies. This gap in income distribution means that people with disabilities are more than twice as likely as other Canadians to be excluded from quality education, sustained and satisfying employment, and engaged participation in their communities (Canadian Association for Community Living, 2005). These facts demonstrate a dynamic relationship among income, education, employment and social environment.
Education is closely tied to socioeconomic status. Quality education for children and lifelong learning for adults are key contributors to health and prosperity (PHAC, 2013). There is a significant discrepancy in the educational attainment between people with disabilities aged 25-54 in Newfoundland and Labrador and their counterparts living elsewhere in Canada (Statistics Canada, 2007). The largest discrepancy is seen in high school completion which is a pre-requisite for post-secondary education. Nationally, about 25% of people with disabilities aged 25-54 have completed high school compared to 12% in Newfoundland and Labrador (Statistics Canada, 2007).
As level of education increases, health status improves (PHAC, 2013). AT is one tool for enhancing access to education. Improving disability supports and accommodations at home and in schools are key strategies for improving access to higher education. For supports to be useful, however, there must be AT literacy on the part of both the consumer and the service provider who offers AT training and matches the right technology to the individual and their needs (Li, Wang & Ho, 2002). Quality education equips people with disabilities with the knowledge, training and skills development that are essential to employment, social inclusion and equal participation in society (Howard, Nieuwenhuijsen & Saleeby, 2008).
Employment is another significant health determinant. Unemployment and underemployment are associated with poorer health (PHAC, 2013). The unemployment rate for people with disabilities in Newfoundland and Labrador is 24.8% compared to 19.8% for the general population in this province (Statistics Canada, 2007). Lack of AT is among the list of barriers that prevent people with disabilities from participating in the labour market (Council of Canadians with Disabilities, 2007). Having AT optimizes health and overall quality of life by facilitating access to sustained and satisfying employment and economic self-sufficiency (Strobel et al., 2006).
How institutions and social structures are organized within a community or province is an indicator of the vitality of a community and the strength of the social support networks. Without accessible and appropriately designed systems, people with disabilities are less able to navigate their environment and assert independence. An environmental scan of government and disability-related organizations in Newfoundland and Labrador identified some that provide AT services to consumers (Independent Living Resource Centre, 2008). Several non-profit organizations – Independent Living Resource Centre, Learning Disabilities Association, and Canadian National Institute for the Blind, to name three – have been instrumental in promoting awareness of AT and providing access to appropriate AT services to people with disabilities in the province. However, residents across the province have complained that some government programs are uncoordinated and waitlists for AT can extend up to two years (Independent Living Resource Centre, 2008). This finding of gaps and inefficiencies in services provision was an impetus for the current study.
Single Entry Point Systems
The Rutgers Centre for State Health Policy defines an SEP as:
a system that enables consumers to access long term and supportive services through one agency or organization. In their broadest forms, these organizations manage access to one or more funding sources and perform a range of activities that may include information and assistance, preliminary screening … assessment of functional capacity and service needs, eligibility determination, care planning, service authorization, monitoring, and reassessment. (Mollica & Gillespie, 2003. p. 1).
In the health care system, an SEP program intends to improve efficiency, response time and access to services, and increased capacity to serve the target population. SEP programs have been implemented for caregiver populations (Toseland, Haigler, & Monahan, 2011), individuals with mental health issues (Arthur, 2005), and those needing cardiac care (Bungard et al., 2009).
To support consumers with disabilities an SEP system for AT might take a similar one-stop approach by providing the right equipment and services to meet specific needs in a timely fashion at a single site. That site would be staffed by knowledgeable service providers with the necessary tools and AT information (Szlamkowicz, 2007). This would mean providing consultation and individualized assessment and appropriate training on the use of a device or technology as well as repair and troubleshooting services. These services might be enhanced with integrated programs such as an AT demonstration centre, an AT reutilization program, or an AT lending program where human and material resources can be better shared and managed.
Ontario and British Columbia introduced one-stop approaches to providing AT services and supports in 1982 and 1993 respectively. In both provinces there was a wide range of individualized, centrally coordinated technology services including assessments, assistive equipment, training, and consultation. Ontario’s Assistive Devices Program was designed to assist residents with long-term physical disabilities in accessing equipment and supplies and generally paid 75-100% of the cost of the AT. The Office of the Auditor General of Toronto (2011) reported that evaluations of these services were positive. They also reported that the Assistive Devices Program increased independence of seniors and people with long-term physical disabilities who were better able to continue living in their communities instead of living in costly institutional settings. The manager of the Assistive Technology British Columbia program emphasized that their program provided equitable and appropriate options for AT and offered a wide range of individualized, centrally coordinated technology services including assessments, assistive equipment, training, and consultation to enable persons with disabilities to achieve educational and employment goals (G. Loewen, personal communication, February 26, 2008).
Some states in Australia introduced comprehensive programs for people with disabilities. The Department for Communities and Social Inclusion Equipment Program was one such program that made significant improvements in equipment services for people with disabilities (Government of South Australia, 2012a). The program provided eligible people with equipment and home modifications for mobility, access, bathing and personal care, seating and communication devices. Key features of the program were: (a) a strategic policy for providing equipment and home modifications (including a “Just Do It” process to ensure that lower risk items such as shower chairs and mobility aids were provided immediately); (b) assessment and prescription occurring locally where possible; (c) maintenance of equipment; and (d) a centralized procurement and warehouse supply model. The latter two features are of particular interest to this discussion making this program distinguishable from other models. An evaluation of this program indicated that a coordinated program was effective in supporting equity and access to AT (Government of South Australia, 2012b). The success of this program was evidence of government commitment to promoting the health of people with disabilities by providing effective and timely individualized supports.
Although SEP systems used in various health care settings have been demonstrated to improve efficiency, response time and access to services, and increase capacity to serve a population (Arthur, 2005; Bungard et al., 2009; Toseland et al., 2011), at the time of this writing, we could find no published cost-benefit analyses of SEP programs for AT. However, there were two studies indicating that coordinated AT care was associated with reduced institutional health care costs and improved health outcomes. Solano and McDuffie (2003) reported that creating mechanisms that enable people to obtain AT helped mitigate health care costs. Similarly, a randomized clinical trial demonstrated a significant difference in functional independence and overall cost of health-related services between persons receiving standard care and those receiving AT services (Mann, Ottenbacher, Fraas, Tomita, & Granger, 1999). At the 18-month follow-up point, an initial investment of $2,000 in AT/environmental intervention (such as the addition of ramps, lowering of cabinets, assistive listening devices) saved about $20,000 in institutional care and in-home care. At the three-year follow-up point, the average net savings was $33,000 per study participant over the three-year period – an average of $11,000 per year.
Cost-benefit analyses of SEP programs in general, and studies relating to the benefits of coordinated programs for AT provide good evidence that an SEP for AT would make sense in terms of positive fiscal and health outcomes. Improving access to AT products and services might reduce overall costs in the health system (Canadian Assistive Devices Association, 2012). To ensure that initiatives are sensitive to geographic, social and economic differences, the distinct challenges faced by rural and remote regions must be examined.
At the time of our study, there was no SEP system for residents with disabilities seeking AT in Newfoundland and Labrador. Some equipment programs existed for borrowing AT for either temporary or permanent use. For example, the Independent Living Resource Centre had a wide range of computer hardware and software available in a fully accessible environment. Anyone could come in and learn what equipment worked best for his or her needs with demonstrations provided by the AT Coordinator. At the Canadian National Institute for the Blind (CNIB), people with vision loss could be assessed with recommendations for appropriate AT and information about funding programs. The CNIB also had a demonstration site where a specialist provides instruction on using AT. The Canadian Hard of Hearing Association of Newfoundland and Labrador provided a Lending Program allowing people with hearing loss to test different devices prior to purchasing AT from a retail outlet. Other organizations accepted previously used AT to add to their inventory of lending materials or for recycling to individuals who couldn’t afford to purchase new items.
Our experience told us that in most cases, services in non-profit organizations in Newfoundland and Labrador were restricted to people with a specific disability and staff were typically self-taught on the AT appropriate to that organization’s mandate. This meant that people with more than one disability had to visit several organizations to meet their AT needs, undergoing more than one consultation and assessment at more than one site – a time consuming and costly undertaking. The finances for these non-profit groups were typically contingent on year to year approval of funding from external sources including government. This situation made the staffing and the provision of AT programs and services unpredictable and insecure.
Research Design
The purpose of this mixed-methods case study was to describe provision and access to AT in Newfoundland and Labrador from the perspective of AT consumers and AT service providers. Our two-fold goal was to: (a) assess their experiences, opinions and satisfaction levels; and (b) assess their attitudes toward three components of an SEP system as part of a more integrated approach to AT service provision. Ethical approval for the study was granted by the Human Investigations Committee of Memorial University.
Creswell (2013) defines a case study as a single context-dependent problem with specific space and time boundaries to focus the intensive exploration of relationships, understandings and personal meanings. Typically, more than one source of data or methodological approach is used. We chose a mixed-method design that allowed us to generate a more complete understanding of AT service provision and maximize the trustworthiness of findings. The “theoretical drive” or the purposeful intention of this project was inductive (Morse & Niehaus, 2009, p. 39). Trustworthiness was built into the design using triangulation of data collection methods and locations, an audit trail of written field notes, and inter-rater agreement on interpretation of qualitative data (Creswell, 2013).
The qualitative component was semi-structured interviews with AT service providers. Interviews enabled us to gain insight into service providers’ knowledge of AT and opportunities for training about AT, the current level of AT service delivery in their region, and perceptions of barriers to receiving and using AT. Interviewees were also asked to comment on the importance of three components of an SEP program: an AT reutilization program, a lending program and a demonstration centre for the province. Recommendations for change were also solicited.
Interviews were conducted between October 2008 and April 2009, audiotaped and later transcribed verbatim. A categorization scheme was developed to organize and index the data. A cross-sectional indexing system was used to generate categories and develop themes systematically across the entire data set (Mason, 2002).
The interview data were used to inform the content and vocabulary of a survey instrument. A survey is an appropriate supplementary component for enhancing description of the issue and for testing for emerging conjecture (Morse & Niehaus, 2009, p. 31). Our survey instrument was inspired by the Quebec User Evaluation of Satisfaction with Assistive Technology version 2.0 (Demers, Weiss-Lambrou, & Ska, 2002) and the Massachusetts Rehabilitation Commission Survey of Assistive Technology (2006). Questions from both were used with permission from the authors. The survey instrument consisted of 45 Likert scale questions, multiple answer questions, and open-ended questions. In addition to consumer socio-demographic data, questions covered AT utilization, barriers to accessing AT, user satisfaction, and if and how AT contributed to independence and various areas of daily life. Questions about familiarity, use and satisfaction with AT programs in the province and the likelihood of using an SEP were added. Open-ended questions about recommendations for change were also included.
At the time of data collection (2008-2009), there was no provincial database of people with disabilities. Therefore, we were unable to compile a sample frame from which to generate a randomized list of potential survey respondents. Instead we accessed our province-wide network of community agencies who agreed to distribute our survey. Unfortunately, just prior to our planned start date for recruiting survey respondents one of our major institutional partners declined to help us recruit survey participants because of resource management issues. As a result we lost a large pool of potential respondents. Our funding and time restrictions prevented us from pursuing other options.
The convenience sample included residents of Newfoundland and Labrador between the age of 19 and 65 years who reported having a disability and experience with AT. The surveys were coded and entered into a statistical software package (SPSS Statistics 16.0, SPSS Inc., 2009). Frequencies, means, standard deviations and chi-square analyses were used to describe responses and the characteristics of the sample.
In the following sections, we present and discuss the findings of the service providers’ interview data and the consumer survey data around four themes that emerged in both data sets: (a) benefits of AT and satisfaction with AT; (b) barriers to AT; (c) self-reported health; and (d) attitudes toward components of an SEP system. We begin by providing an overview of the socio-demographics of both respondent groups including information on consumers’ AT utilization.
Demographics of respondents and consumer AT utilization
Eight service providers working in pivotal locations were interviewed with regional representation in all four provincial health authorities. Interviewees ranged in age from 35-60 years. Their level of education ranged from 2-4 years of college or university to a master’s degree with specialization in student services. The interviewees had 2-27 years of experience working within the field of disabilities with an average of 11 years. Two key informants were AT consultants from community organizations, two were disability services coordinators at post-secondary institutions, one was the manager of an employment centre, one was the president of a provincial advocacy organization, and one was a student development officer.
A total of 61 hard copy and web-based surveys were received. One of the hard copies and eleven of the web-based surveys were omitted from data analysis because of missing or incomplete information. The remaining sample (n=49) consisted of 26 females (53.1%) and 23 males (46.9%). The mean age was 35.26 years (ranging from 19-58 years) with 30.6% (n=15) aged 26-35 years, representing the largest single age group. The majority (67.3%, n=33) of survey respondents reported living with a partner/spouse/family member, fewer (22.4%, n=11) were living alone, and 10.2% (n=5) were living with roommates.
Regional location was collapsed into two categories; those living in St. John’s and vicinity (79.6%, n=39) and those living outside St. John’s (20.4%, n=10) with representation from rural areas (6.1%, n=3). When compared to the distribution of the provincial population in general, the sample overrepresented those living in urban centres.
About half of the survey respondents (51%, n=25) were employed and 49% (n=24) were unemployed. Four indicated they were unemployed because of their disability. Seventeen respondents (34.7%) were enrolled in college or university. The largest percentage of respondents (30.6%, n=15) reported household annual income of $10,001 to $30,000.
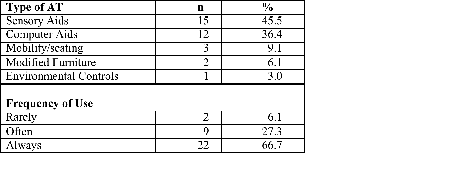
Of the 49 respondents in the sample, 42 (85.7%) reported using or having AT (See Table 1). Of those, 33 (78.57%) reported recently obtaining it. When asked about frequency of use, 66.7% (n=22) said they always used it, 27.3% (n=9) reported using it often, while 6.1% (n=2) said they rarely used their AT.
Table 1. Recently obtained AT and frequency of usea
n=33
Benefits of AT and level of satisfaction
Service providers agreed that AT promotes consumer independence and more equitable access to many aspects of life and social engagement. Several commented that access to AT increased access to employment opportunities for people with disabilities. All interviewees expressed frustration with the level of AT service delivery in the province and advocated for improvements. One service provided stated that he had seen “deterioration in many of the services with interventions that have been sometimes government based, sometimes interest group based.” Several providers commented that any AT service provided in the province should take a cross-disability approach, in other words, serve individuals across the spectrum of disability categories.
Consumers completing the survey rated the satisfaction items for device and services on a 5-point Likert scale. Most respondents (58.3%, n=21) reported overall satisfaction with their recently acquired AT. A cross-tabulation between overall satisfaction with AT device and satisfaction with how individual preferences and needs were considered during the selection process revealed that 66.7% (n=10) of respondents who were satisfied with their AT also said they were quite satisfied with how their needs and preferences were considered. In comparison, 75% (n=3) of those who said they were not at all satisfied with how their specific needs and preferences were considered during the selection phase, reported being “not satisfied at all” with their AT. A chi-square test between satisfaction with AT and satisfaction with consideration of needs and preferences revealed a significant relationship (χ2=36.114, df=8, p < .001).
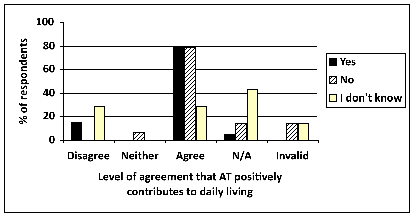
Figure 1 shows the perceived impact of AT on daily living by cross-tabulating respondents’ perceptions of whether AT contributed to their daily living and whether they felt they had unmet AT needs. Eighty percent (n=16) of respondents who agreed that AT contributed to daily life reported unmet AT needs. A chi-square test between this rating and respondents’ unmet AT needs indicated a statistically significant relationship (χ2=26.80, df=9, p<.005).
Figure 1. Perception of the contribution of AT to daily living and unmet needs.
Figure 1 shows the shows the results of a cross tabulation between whether respondents perceived that AT contributed to their daily living and whether they felt they had unmet AT needs. The figure shows rows of bars representing the percentage of respondents who answered yes, no or I don’t know to the question of whether they have unmet AT needs within each level of agreement for how AT contributes to daily living.
Barriers to AT
Four main barriers to AT were identified in interviews with service providers: (a) the lack of consistency in the quality and quantity of AT information; (b) the insufficient number and availability of trained personnel; (c) the lack of qualified people to conduct assessments; and (d) the high cost of AT and AT assessments and lack of funding support.
All service providers spoke about the quality and quantity of AT information. They reported that there was a need for a feedback loop when matching the appropriate AT to meet the needs of individuals with specific disabilities. One service provider noted, “So, to know specifically what’s good out there for a certain client … that would be nice to know. It would be nice to have the information to see what would be a good program that you could buy.”
Service providers reported having varied levels of AT training necessary to prepare them to do their job. While some interviewees reported having some training from a variety of sources, others reported having no training at all. One individual who worked in the employment services sector said that there is “absolutely nothing. I don’t even have it. And I’m managing the place… I wouldn’t know where to go and where to start.” In some cases, the lack of training for service providers meant that the AT equipment that was purchased was abandoned or obsolete. Thus, insufficient formal training translated into difficulty with identifying and recommending appropriate AT support because of their own lack of knowledge about the ever-changing range of AT. Without appropriate training they were unable to help consumers identify appropriate AT to meet their needs and provide them with adequate training on the use of that AT. Our findings were consistent with previous studies indicating that technology without the training is useless (Szlamkowicz, 2007).
One key informant located responsibility with the government’s failure to address this gap pointing to:
the need to have training available for employers, managers, service providers and people with disabilities and they should focus on that … and there should be emphasis put on training and what’s available out there. And set up a program so that there is regular training. I mean, technology’s changing so fast, I mean, it needs to be a regular thing. It could be a full time job for people!
Lack of training extended to performing appropriate AT assessments and the resulting gap this produced among post-secondary students with disabilities. One provider said, “There’s a lack of qualified people to be able to do the assessment for this information. That’s obviously going to continue to be an issue.” Another went on to say:
With regard to assessments, that’s a real interesting thing because what’s happened is … people talk about assessments. That’s not happening. It hasn’t been happening. You know, they’re starting to work on it now. They’ve designated… guidance counselors are mainly doing assessments out in the school system.
In addition to the lack of trained personnel to perform assessments, service providers identified funding for AT assessments as a significant barrier to obtaining AT particularly for post-secondary students. They reported that provincial and federal funding for AT often required written documentation of a disability provided by a licensed professional who administered a psycho-educational assessment. Although the Canada Study Grant reimbursed 75% of the cost of the assessment to a maximum of $1200 for each student, the up-front cost of completing this assessment was considered prohibitive for many.
Add to the cost of an assessment was the cost of purchasing AT which was reported to be far beyond the financial reach of many individuals. Service providers highlighted the difficulties residents living in this province have obtaining AT due to financial barriers. One interviewee characterized AT as being as essential to good health as medications:
Where you need the resource, it should be there for you to get no matter how much money you make, or how little money you make. If it’s something you need to get through everyday life, then to me it’s no different than needing medication or anything else. It’s just part of what you need, so we severely lack that.
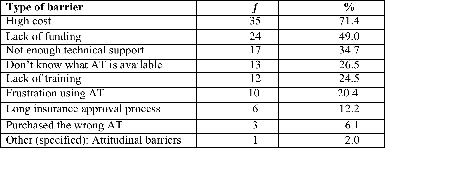
Consumers confirmed what we heard from service providers when we asked about barriers to acquiring appropriate AT to meet their needs (see Table 2). The majority of respondents (71.4%, n=35) cited the high cost of AT as the most significant barrier to accessing AT, followed by a lack of funding to defray the cost (49%, n=24). Lack of technical support (34.7%, n=17), not knowing what AT was available (26.5%, n=13), and lack of training for AT users (24.5%, n=12) were also cited as barriers.
Table 2. Barriers identified by consumers to acquiring appropriate AT
n=46 respondents
Four of seven respondents who reported not using AT reported high cost, lack of skilled professionals, and lack of awareness about what AT devices were available as barriers to getting the right AT to suit their needs. These four respondents also reported annual household income levels of $10,000 or less.
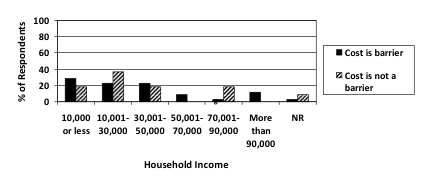
The largest percentage of our respondents reported an annual household income of $10,001 to $30,000. Although ours was not a representative sample, this percentage was comparable to the average income of $20,428 for adults with disabilities in Newfoundland and Labrador reported in a national Statistics Canada (2007) survey. Figure 2 shows the cross-tabulation of household income and cost of AT as a barrier to securing AT. Over half (51.5%, n=18) of the 35 respondents who indicated that high cost was a barrier to acquiring AT also reported a household income of $30,000 or less.
Figure 2. Household income of survey respondents and cost as a barrier to AT.
Figure 2 shows the results of a cross-tabulation between household income and cost of AT as a barrier to securing AT. The figure shows rows of bars representing the percentage of respondents who answered yes or no to cost being a barrier within each of the income categories.
Of those who obtained AT, 30% (n=12) reported receiving funding from government programs and 15% (n=6) said their AT was paid for or provided by someone else, such as an employer. Of the 37.5% (n=15) of respondents who reported paying for AT themselves, the majority (60%, n=9) reported unmet AT needs. Of these, 35% (n=7) reported an income level of $30,001-$50,000; 25% (n=5) reported an income level of $10,001-$30,000; and 10% (n=2) reported an income level of $10,000 or less. Given that the modal household income for survey respondents was $10,001- $30,000, it is worrisome to see that consumers tended to pay for most or all of their AT themselves rather than benefitting from government funding. This finding is consistent with national and international surveys reporting that most adults with disabilities pay for their AT devices themselves (Statistics Canada, 2008b).
The high cost of AT, difficulties meeting government criteria for funding, and delays in receiving government funding for AT were all cited as barriers. This study confirms previous studies that found the high cost of many technologies was a serious barrier to maximizing the use of their technology (DeJonge & Rodger, 2006; Scherer, 2005). Although obtaining AT was identified as being very important to consumers and service providers, being able to properly and effectively use the acquired AT was also very important. These results are consistent with other studies (Hoppestad, 2007; Human Resources and Skills Development Canada, 2003; Statistics Canada, 2006). Respondents said that having accessible information explaining where to go and how to access current funding for AT were critical aspects of service delivery. Several respondents recommended improving government funding structures and mentioned other provinces such as Ontario, Quebec, Prince Edward Island, Saskatchewan, and Alberta with cost sharing programs for the purchase of personal or household AT. Subsidized AT programs were regarded as an important way to improve access to AT.
AT and self-reported health and daily living
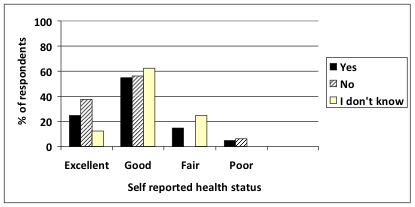
Consumers (93.8%, n=15) who reported that they did not have unmet AT needs also indicated excellent or good health (37.5%, n=6; 56.3%, n=9 respectively). See Figure 3. Respondents who reported that their AT needs were not met were less likely to report excellent or good health (25%, n=5; 55%, n=11respectively). A chi-square test indicated a statistically significant relationship between self-reported health status and unmet AT needs (χ2=2.88, df=3 p<.005).
Figure 3. Self-reported health status and unmet needs.
Figure 3 shows the results of a cross tabulation between self-reported health of respondents and whether they feel they have unmet AT needs. The figure shows rows of bars representing the percentage of respondents who answered yes, no or I don’t know to the question of whether they have unmet AT needs within each of the categories of health status (excellent, good, fair and poor).
The overall health of consumers with disabilities was shown to be related to lack of appropriate AT. People whose AT needs were met tended to report better overall health. Moreover, those who reported being satisfied with their involvement in the selection process for their AT expressed good or excellent self-reported health. Our findings were consistent with other studies reporting that the quality of life and overall health of an individual and their access to educational and employment opportunities was positively correlated with access to suitable AT (Mann et al., 1999; Solano & McDuffie, 2003).
Service providers and consumers were asked about their familiarity and attitudes about three components of an SEP: a recycling program, a lending program and an AT demonstration centre. At the time of this study, there were several disability organizations offering at least one of the three components. Only some of the service providers were aware that these programs were operating in the province. Those who were familiar with the programs were enthusiastic ranking the AT demonstration centre, the lending program and recycling program first, second and third, respectively, in order of preference. However, one respondent made the argument that, “Ideally, I think you can come up with a system that incorporates all three. I don’t see any reason why not … Those are three core components of success.”
Another prominent theme was the lack of a centralized training centre that would serve as an initial entry point for receiving information and training on a wide range of aids and adaptations as well as accessing technical support. According to one service provider, “Everybody’s doing a little bit of something . . . [but] is there a one-stop shopping? That somebody can go into and get an assessment, training, technical support, troubleshooting, a borrowing system like they have in B.C.?”
Implications for change
We used a social justice lens to examine the adequacy of existing AT programs and services for people with disabilities with a view to making recommendations for enhancing individual and collective health in an oftentimes disadvantaged population. The Commission on Social Determinants of Health attributes health inequalities to “a toxic combination of poor social policies and programs, unfair economic arrangements, and bad politics” (2008, p. 26). This study revealed a similar harmful mix in Newfoundland and Labrador: (a) consumers and service providers dissatisfied with the adequacy of existing programs and services; (b) agencies often focused on serving individuals with a specific disability operating with insecure funding sources and staffed by individuals with limited training; and (c) a system characterized by limited flexibility and complex and inter-related barriers to providing appropriate AT, support and training to meet the increasing demand. What made this case study unique was that the provincial population was dispersed over a wide geographic area in small urban, rural, and remote communities. This province also had one of the fastest aging populations in Canada, a fact known to increase demand for AT (Mann et al., 1999; Scott et al., 2010). These two facts pose distinct challenges for designing an effective solution.
We concluded that the provincial government working in concert with funding agencies and community organizations has an obligation to heed the findings of this study and commit to developing a coherent strategy to enhance effectiveness and utilization of existing and future AT programs. Without a comprehensive, cross-disability approach to AT provision, many people will continue to have unmet AT needs that interfere with their right to good health in the broadest sense. Providing AT supports for people with disabilities will promote health by optimizing access to education and employment, and facilitating social and economic wellbeing. The failure to act or to do so quickly will negatively impact the health of people with disabilities (Kaye et al., 2008) or at the very least delay the positive outcomes that can accrue to those with access to AT.
In a discussion paper to the Treasury Board of Canada Secretariat, Aucoin (2005) outlined the critically important but challenging nature of effecting change:
Commitment to the use of evidence is not always what it needs to be, at the levels of ministers or senior officials or both; … the use of evidence on effectiveness and performance in government decision-making is a necessary condition of good governance and public management. Political responsiveness and fiscal discipline are necessary but they are not sufficient … Continuous efforts to ascertain and assess program effectiveness are therefore incumbent on government decision-makers and managers.
We believe that the release of the Strategy for the Inclusion of Persons with Disabilities by the Disability Policy Office of the Government of Newfoundland and Labrador (2012) was an important first step and a hopeful indicator that the government is committed to effecting change.
The next logical step for the Office would be to conduct a feasibility study to determine if implementing an integrated SEP system funded by the provincial government would improve access to AT in a jurisdiction with a significant rural population. While this study did not investigate the relative merits of an SEP over a multiple entry point system, the current evidence suggests that an SEP system has six potential benefits: (a) simplified access to cross-disability services through a single portal; (b) more efficient use of limited resources by incorporating a demonstration centre, a lending program and a recycling program; (c) reduced need for multiple consultations and assessments; (d) better and coordinated formal training for co-located AT staff; (e) improved flow of information between consumers and service providers; and (f) coordinated funding streams (Government of South Australia, 2012a; 2012b; Mann et al, 1999; Solano & McDuffie, 2003).
Partnerships between governments and community-based agencies will be an essential feature of any plan to move forward. But it will not be without challenges. At the time of this writing, the head offices of several community-based organizations that offer some AT services are located in the provincial capital. In most cases, such organizations have a mandate to deliver services to people with a specific disability (e.g., the CNIB addresses the needs of those with vision loss). This represents not only a long-standing commitment to delivering services in a particular way but also organizational structure and visibility that extend beyond provincial borders. Effecting change will involve addressing historical and political investments in agency identity and practice with a view to re-imagining solutions.
Limitations
Our experience completing this study taught us the value of establishing sturdy partnerships with post-secondary institutions and industry and other sites with an accessible and concentrated population of people with disabilities. A provincial database of people with disabilities might facilitate inclusion in future research and program intervention efforts. We also learned that a data collection tool must be inclusive of the multiple ways that individuals might participate (e.g., paper-based, electronic, large font, voice enabled, and literacy level). We acknowledge that the qualitative and quantitative samples were small and purposive limiting the types of analyses performed and the generalizability of our findings. However, our findings were internally consistent across data sets and externally consistent with other studies confirming the trustworthiness of our findings.
References
Arthur, A. R. (2005). Layered care: A proposal to develop better primary care mental health
services. Primary Care Mental Health, 3(2), 103-109.
Aucoin, P. (2005). Decision-making in government: The role of program evaluation. Retrieved
from: www.tbs-sct.gc.ca/cee/tools-outils/aucoin-eng.asp#sec1
Bungard, T. J., Smigorowsky, M. J., Lalonde, L. D., Hogan, T., Doliszny, K. M., Gebreyesus,
G., Archer, S. L. (2009). Cardiac EASE (Ensuring Access and Speedy Evaluation). The impact of a single-point-of-entry multidisciplinary outpatient cardiology consultation program on wait times in Canada. Canadian Journal of Cardiology, 25(12), 697-702.
Canadian Assistive Devices Association. (2012). Strategic Plan 2010/2011. Retrieved from:
www.cadaonline.ca/pdf/CADA-Strat-Plan-June-2012.pdf
Canadian Association for Community Living. (2005). Building an inclusive and accessible
Canada. Retrieved from: www.ccdonline.ca/en/socialpolicy/actionplan/inclusive-accessible-canada
Christ, T. (2008). Technology support services in postsecondary education: A mixed methods
study. Technology and Disability, 20, 25-35.
Commission on Social Determinants of Health. (2008) Closing the gap in a generation: Health
equity through action on the social determinants of health: Final report. Geneva: World Health Organization. Retrieved from: www.who.int/social_determinants/thecommission/finalreport/en/index.html
Council of Canadians with Disabilities. (2007). Consumers with disabilities speak out on health
issues. Retrieved from www.ccdonline.ca/publications/Health%20Issues/healthissues.htm
Creswell, J.W. (2013). Qualitative inquiry and research design: Choosing among five
approaches. Los Angeles: Sage.
DeJonge, D. M., & Rodger, S. A. (2006). Consumer-identified barriers and strategies for
optimizing technology use in the workplace. Disability and Rehabilitation: Assistive Technology, 1, 1748-3107.
Demers, L., Weiss-Lambrou, R., & Ska, B. (2002). The Quebec User Evaluation of Satisfaction
with Assistive Technology (QUEST 2.0): An overview and recent progress. Technology and Disability, 14, 101-105.
Government of Newfoundland and Labrador. (2012). Provincial strategy for the inclusion of
persons with disabilities in Newfoundland and Labrador. Retrieved from: www.aes.gov.nl.ca/disabilities/consultations.html
Government of South Australia. (2012a). Equipment program. Retrieved from:
Government of South Australia. (2012b). Provision and access to aids and equipment in
Australia. Retrieved from:
www.aihw.gov.au/WorkArea/DownloadAsset.aspx?id=6442455719
Hopkins, J. (2004). Assistive technology (AT) to support students with special needs. Retrieved
from: www.curriculum.org/storage/108/1278482872AssistiveTechnology.pdf
Hoppestad, B.S. (2007). Inadequacies in computer access using assistive technology devices in
profoundly disabled individuals: an overview of the current literature. Disability and Rehabilitation: Assistive Technology, 2, 189-199.
Howard, D., Nieuwenhuijsen, E. R., & Saleeby, P. (2008). Health promotion and education:
Application of the ICF in the US and Canada using an ecological perspective. Disability and Rehabilitation, 30(12/13), 942-954.
Human Resources and Skills Development Canada. (2003). Defining disability: A complex
issue. Retrieved from: http://dsp-psd.communication.gc.ca/Collection/RH37-4-3-2003E.pdf
Independent Living Resource Centre. (2008). Adult learners. Retrieved from:
www.ilrc-nl.ca/brochure/sites/default/files/adultlearners.pdf
Kaye, H., Yeager, P., & Reed, M. (2008). Disparities in usage of assistive technology among
people with disabilities. Assistive Technology, 20(4), 194-203.
Li, T-Y., Wang, H-P., Ho, R-G. (2002). A survey of the adaptive computer technology literacy
for in-service special education teachers in Taiwan. International Journal of Rehabilitation Research, 25, 337-339.
Mann, W. C., Ottenbacher, K. J., Fraas, L., Tomita, M., & Granger, C. V. (1999). Effectiveness
of assistive technology and environmental interventions in maintaining independence and reducing home care costs for the frail elderly. Retrieved from: www.orcatech.org/papers/home_monitoring/99_Mann_effectiveness_of_envrionmental_interventions.pdf
Mason, J. (2002). Qualitative researching (2nd Ed.). Thousand Oaks, CA: Sage Publications.
Massachusetts Rehabilitation Commission. (2006). Massachusetts state plan for assistive
technology. Boston, MA; Elmer C. Bartels.
Mollica, R., & Gillespie, M. (2003). Single entry point systems: State survey results. Retrieved
from: www.nashp.org/sites/default/files/CLE_single_entry_point.pdf
Morse, J.M., & Niehaus, L. (2009). Mixed method design: Principles and procedures. Walnut
Creek, CA: Left Coast Press.
Office of the Auditor General of Toronto (2011). Assistive devices program: Follow-up.
Ministry of Health and Long-term Care. Retrieved from: www.auditor.on.ca/en/reports_en/en09/301en09.pdf
Penton, V., & Gustafson, D.L. (2010). Assistive technology provision: An assessment of services
and supports for people with disabilities in Newfoundland and Labrador. Report for the Disability Policy Office, Department of Human Resources, Labour and Employment, Government of Newfoundland and Labrador.
Public Health Agency of Canada (PHAC). (2013). What makes Canadians healthy or unhealthy?
Retrieved from: www.phac-aspc.gc.ca/ph-sp/determinants/determinants-eng.php#income
Scherer, M. J. (2005). Assessing the benefits of using assistive technologies and other supports
for thinking, remembering and learning. Disability and Rehabilitation, 27, 731-739.
Scott, V., Wagar, L., & Elliott, S. (2010). Falls and related injuries among older Canadians:
Fall‐related hospitalizations and intervention initiatives. Victoria, BC: Victoria Scott Consulting.
Solano, P. L., & McDuffie, M. J. (2003). Cost benefit analysis of the Delaware Alternative
Financing Loan Program of Assistive Technology for the disabled. Retrieved from: www.udel.edu/healthserpolresgrp/Report%20for%20Technology2.pdf
Statistics Canada. (2006). Census profile of federal electoral districts (2003 representation
order): Language, mobility and migration and immigration and citizenship. Retrieved from: http://www5.statcan.gc.ca/bsolc/olc-cel/olc-cel?catno=94-577-X2006007&lang=eng
Statistics Canada. (2007). Participation and activity limitation survey 2006: Technical and
methodological report. Retrieved from: www.statcan.gc.ca/pub/89-628-x/89-628-x2010015-eng.htm
Statistics Canada. (2008a). 2006 Community profiles: St. John's metropolitan areas,
Newfoundland and Labrador. Ottawa: 2006 Census.
Statistics Canada. (2008b). Participation and activity limitation survey 2006: Analytical report.
Retrieved from: www.statcan.gc.ca/pub/89-628-x/89-628-x2007002-eng.htm
Strobel, W., Fossa, J., Arthanat, S., & Brace, J. (2006). Technology for access to text and
graphics for people with visual impairments and blindness in vocational settings. Journal of Vocational Rehabilitation, 24(2), 87-95.
Szlamkowicz, D. (2007). Challenges in assistive technology services in Quebec: A clinician's
perspective. Retrieved from: www.erudit.org/livre/crir/2007/livrel6_div13.pdf
Toseland, R. W., Haigler, D. H., & Monahan, D. J. (2011). Current and future directions of
education and support programs for caregivers. In R.W. Toseland, D. H. Haigler, & D. J. Monahan, D. J. (Eds.). Education and support programs for caregivers (pp. 149-158). New York: Springer.